This week’s assignment was to create a sketch that employs an external data source. I had done this in one of my last assignments, where I was pulling data information from a CSV file to visualize the changing water levels in Lake Powell.
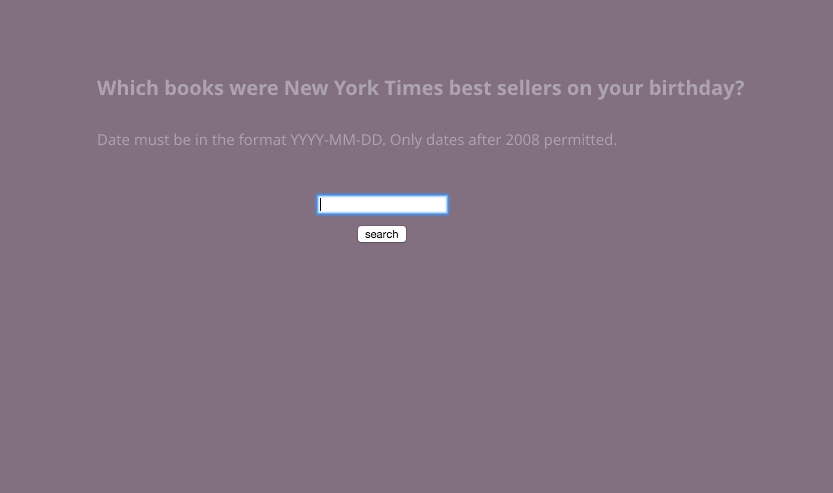
For this week’s project, I decided to work with the New York Times’ API to pull the NYT’s weekly Best Sellers list. I wanted to create a simple search so that users could see what the most popular books were on their birthday. Unfortunately, the API only allows you to pull data as early as 2008 but I decided to finish the project anyway.
Before getting too deep into the project, I decided to make sure the NYT’s API was easy to use with ample documentation. Unlike the Goodreads API (which I’d spent a few hours playing around with), the NYT API is pretty intuitive and easy to use. It has a Best Sellers API that you can use after you’ve obtained the appropriate API key.
The URL that gets called each time a user searches is this:
http://api.nytimes.com/svc/books/v2/lists/overview.json?published_date=2012-11-18&api-key=f175980bb4d8913503354046d03a662b:4:56111762
Before writing any code, I had to construct the URL so that the input, which is a date (2012-11-18), gets wedged into the middle of the url.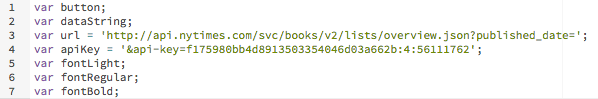
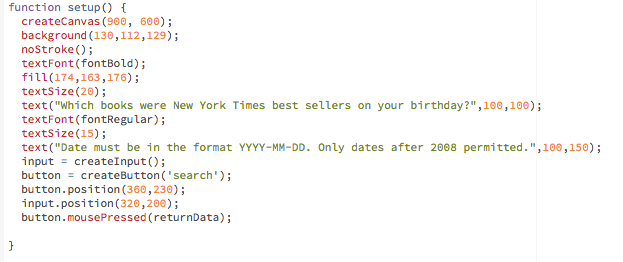
Then in the function setup (), I created a button and a search bar. I also called a new function returnData() which pulls the data as soon as the mouse is pressed.
The function returnData() constructs the URL as dataString and loads the JSON file. A JSON, or JavaScript Object Notation, is a programming language that parses and translates data into JavaScripts objects and arrays. The loadJSON() function takes two parameters: the URL (dataString) and what you’re telling the sketch to draw once you have the data (gotData).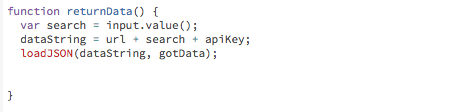
Finally, the function gotData() is defined. Figuring out how to get the right data from the JSON file was tricky. The JSON file provides a series of objects and arrays nested in each other. There’s a lot of information to work with for each book: The title, the author, the publish date, an image of the cover, the price, the ISBN, the publisher, the contributor, the list, etc.
I decided I just wanted my function to pull pictures of the front covers of each book. To do so, I had to first create an empty array and push the URLs for the image into the new array. I printed the array to make sure it worked!
Next, I needed to use the p5.dom library in order to get the appropriate images from the URLs. I was introduced to the function createImg(), which creates images from the URL that appears in the parameter.
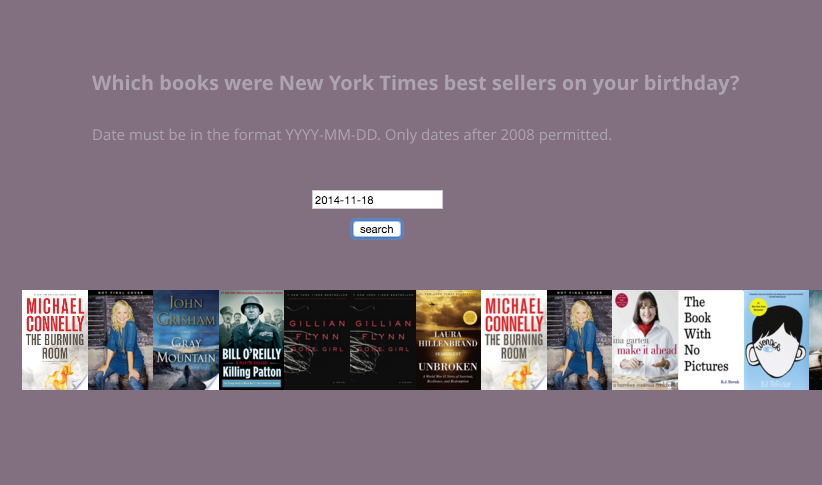 That’s it! I got the search working. There were several lingering issues with the sketch that I didn’t have enough time to resolve, namely:
- There are duplicate book covers. Because I didn’t specify which Best Seller list to display, it’s displaying all of them at once. As such categories like hardcover_fiction and ebook_fiction are going to have repeats.
- The book covers aren’t wrapping. The books appear in a straight line because we added ‘inline-block’ to the display style, but the books do not wrap in order to fit within the canvas.
- The dates only go back to 2008. This is the only data the NYT API provided.
- The input is awkward. Entering in a date with the format YYYY-MM-DD is unwieldy. I would need to create three dropdowns or inputs so that users could enter the date information more easily.
See my full code here.
One thought on “First p5.js sketch using the NYT API.”