Screen Shot 2015-11-08 at 4.42.36 PM

Lately I’ve noticed something strange: Conversations about technology often locate themselves in the realm of the magical or the supernatural.

The sci-fi genre is replete with descriptions of machines that use language linked to animism, magic, witchcraft, the occult, and ghosts. In William Gibson’s 1984 sci-fi novel Neuromancer, the protagonist Case describes the posthuman body as “data made flesh,” a reference to Christian ontology and Jesus’ divine personhood.

These types of metaphors reaffirm one of the central assumptions at the core of the sci-fi genre: Breathing life into a machine is not far off from breathing life into a human body.

Similarly, the language used by today’s Silicon Valley tech kingpins reveals patterns in their thinking that link artificial intelligence to animism. “With artificial intelligence we’re summoning the demon,” remarked Tesla CEO Elon Musk in a 2014 MIT symposium. “You know those stories where there’s a guy with the pentagram, and the holy water, and he’s sure he can control the demon? Doesn’t work out.”

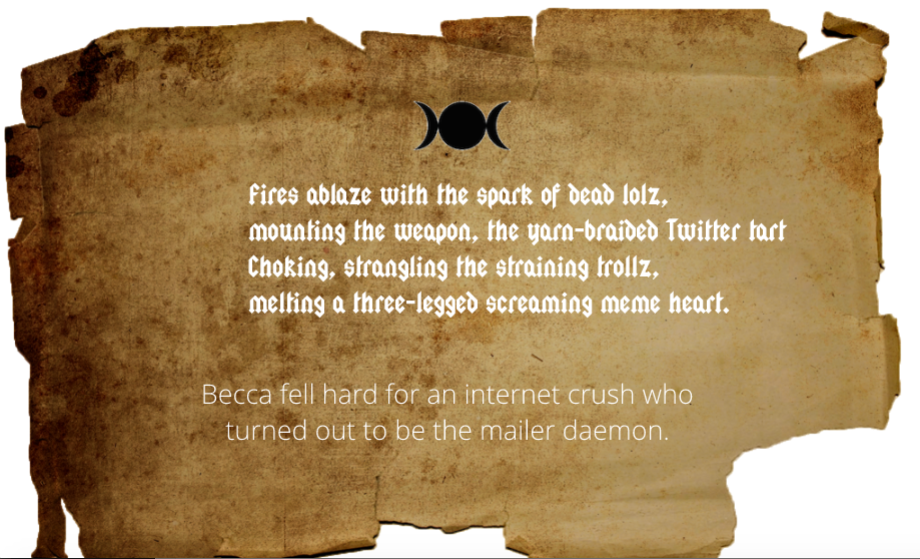
In a wonderful blog post entitled “Living with our Daemons,” Ingrid Burrington reminds us that Musk’s invocation of a metaphor to the supernatural is actually standard fare in the digital age. We’ve been living with so-called ghosts on the internet for a long time: Software wizards walk us through software installations, apps work “like magic,” and emails bounce back into our inbox from the mysterious MAILER-DAEMON. Evidently the tech world loves a good ghost story.

With that in mind, I decided to make a funny little game in p5.js in which users are prompted to “cast spells” on their internet enemies. Our assignment was to use some external media source in the sketch.

Check out my game here. 

Screen Shot 2015-11-08 at 4.36.43 PM

Screen Shot 2015-11-08 at 4.37.11 PM

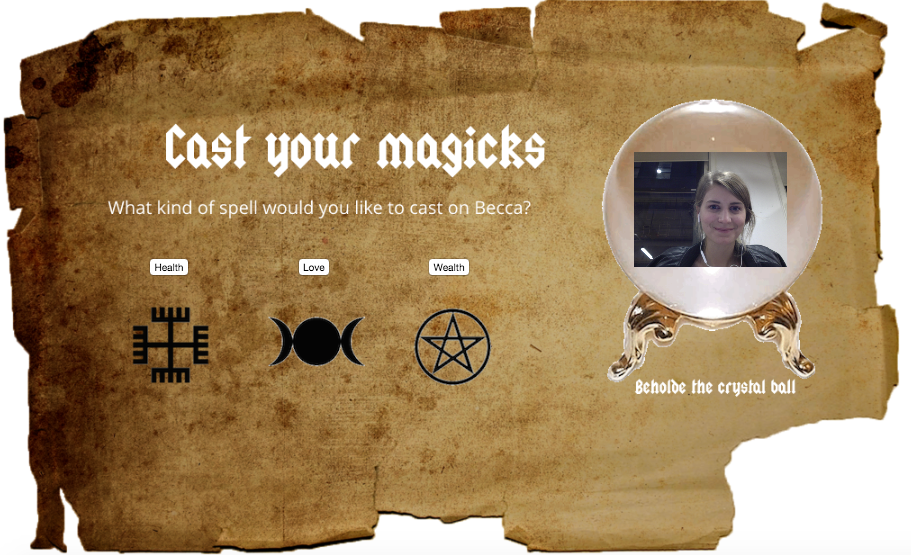
The code for the game was fairly simple: I used dom elements to create buttons and capture video from a webcam.

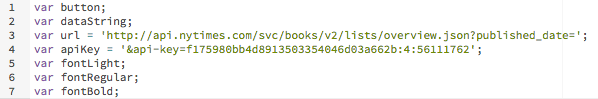
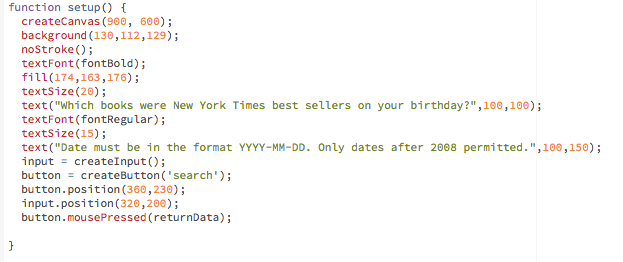
Here’s the full code:

I’m satisfied with the way the project turned out. Here’s a video of someone (me) interacting with the interface:

Screen Shot 2015-10-27 at 1.01.55 PM

This week’s assignment was to create a sketch that employs an external data source. I had done this in one of my last assignments, where I was pulling data information from a CSV file to visualize the changing water levels in Lake Powell.

For this week’s project, I decided to work with the New York Times’ API to pull the NYT’s weekly Best Sellers list. I wanted to create a simple search so that users could see what the most popular books were on their birthday. Unfortunately, the API only allows you to pull data as early as 2008 but I decided to finish the project anyway.

See the final sketch here.

Before getting too deep into the project, I decided to make sure the NYT’s API was easy to use with ample documentation. Unlike the Goodreads API (which I’d spent a few hours playing around with), the NYT API is pretty intuitive and easy to use. It has a Best Sellers API that you can use after you’ve obtained the appropriate API key.

The URL that gets called each time a user searches is this:

http://api.nytimes.com/svc/books/v2/lists/overview.json?published_date=2012-11-18&api-key=f175980bb4d8913503354046d03a662b:4:56111762

Before writing any code, I had to construct the URL so that the input, which is a date (2012-11-18), gets wedged into the middle of the url.Screen Shot 2015-10-27 at 1.25.02 PM


Then in the function setup (), I created a button and a search bar. I also called a new function returnData() which pulls the data as soon as the mouse is pressed.

Screen Shot 2015-10-27 at 1.26.08 PM


The function returnData() constructs the URL as dataString and loads the JSON file. A JSON, or JavaScript Object Notation, is a programming language that parses and translates data into JavaScripts objects and arrays. The loadJSON() function takes two parameters: the URL (dataString) and what you’re telling the sketch to draw once you have the data (gotData).Screen Shot 2015-10-27 at 1.38.10 PM


Finally, the function gotData() is defined. Figuring out how to get the right data from the JSON file was tricky. The JSON file provides a series of objects and arrays nested in each other. There’s a lot of information to work with for each book: The title, the author, the publish date, an image of the cover, the price, the ISBN, the publisher, the contributor, the list, etc.

I decided I just wanted my function to pull pictures of the front covers of each book. To do so, I had to first create an empty array and push the URLs for the image into the new array. I printed the array to make sure it worked!

Next, I needed to use the p5.dom library in order to get the appropriate images from the URLs. I was introduced to the function createImg(), which creates images from the URL that appears in the parameter.Screen Shot 2015-10-27 at 1.41.11 PM


Screen Shot 2015-10-27 at 1.02.15 PMThat’s it! I got the search working. There were several lingering issues with the sketch that I didn’t have enough time to resolve, namely:

  1. There are duplicate book covers. Because I didn’t specify which Best Seller list to display, it’s displaying all of them at once. As such categories like hardcover_fiction and ebook_fiction are going to have repeats.
  2. The book covers aren’t wrapping. The books appear in a straight line because we added ‘inline-block’ to the display style, but the books do not wrap in order to fit within the canvas.
  3. The dates only go back to 2008. This is the only data the NYT API provided.
  4. The input is awkward. Entering in a date with the format YYYY-MM-DD is unwieldy. I would need to create three dropdowns or inputs so that users could enter the date information more easily.

See my full code here.