 Photograph by Michael Melford, National Geographic Creative
I’ve been living in Utah for the last six years, give or take, and my friends and I have spent a lot of time exploring southern Utah national and state parks.
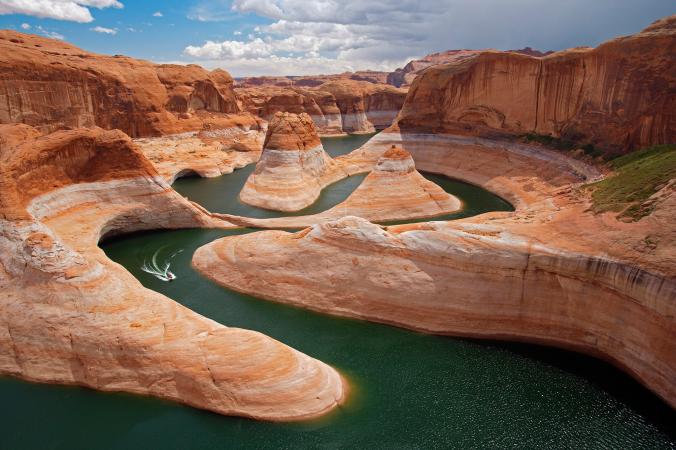
One of the most iconic bodies of water in the region is Lake Powell, a reservoir on the Colorado River that straddles both Utah and Arizona. Lake Powell is best known for its orange-red Navajo Sandstone canyons, clear streams, diverse wildlife, arches, natural bridges, and dozens of Native American archeological sites.
Since its 1963 creation, Lake Powell has become a major destination for the two million visitors it attracts annually. You can see why we love spending time there:
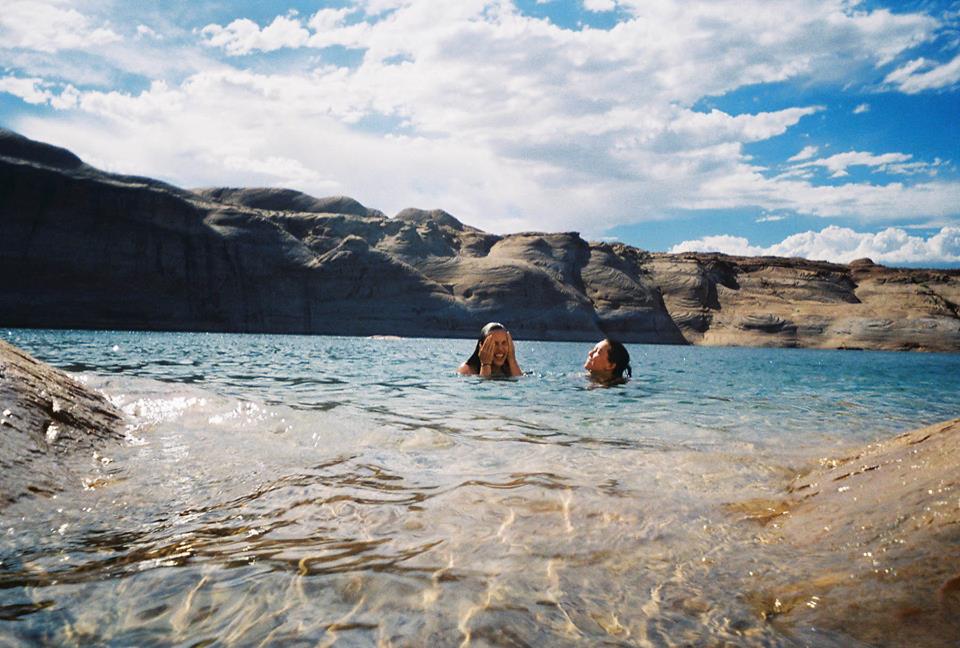 Photograph by my friend Kelsie Moore.
 Photograph by my friend Kelsie Moore.
Lake Powell is the second-largest man-made reservoir in the U.S., storing 24,322,000 acre feet of water when completely full. The lake acts as a water storage facility for the Upper Basin States (Colorado, Utah, Wyoming, and New Mexico) but it must also provide a specified annual flow to the Lower Basin States (Arizona, Nevada, and California).
Recent drought has caused the lake to shrink so much, however, that what once was the end of the San Juan River has become a ten-foot waterfall, according to National Geographic. As of 2014, reservoir capacities in Lake Powell were at 51% and the nearby Lake Mead was at 39%.
Drought has really reshaped the Colorado River region. According to the U.S. Drought Monitor, 11 of the past 14 years have been drought years in the southwest region, ranging from “severe” to “extreme” to “exceptional” depending on the year. You can see how drastically the landscape has changed over the past decade by taking a look at this series of natural-color images taken by a the Landsat series of satellites.
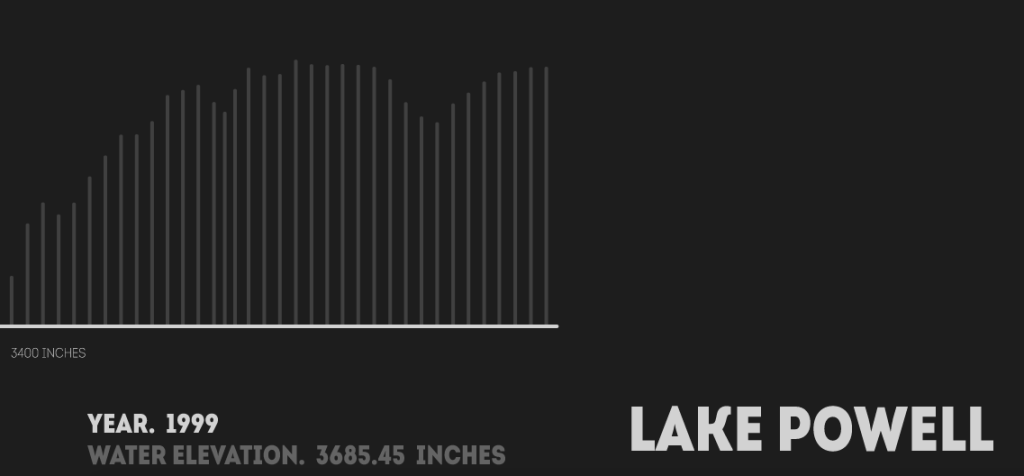
This week in ICM, we’re learning how to use objects and arrays in javascript. I wanted to produce a simple data visualization that displayed historical data about the water elevation in Lake Powell since its creation in the 1960s. I also knew that I wanted to use some kind of organic sound in the visualization, exploring p5.sound library.
See the final visualization here.
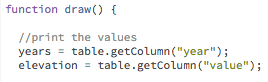
I found a database online that contained the information I needed and I created a CVC file that detailed the year in one column and the elevation values in another column.
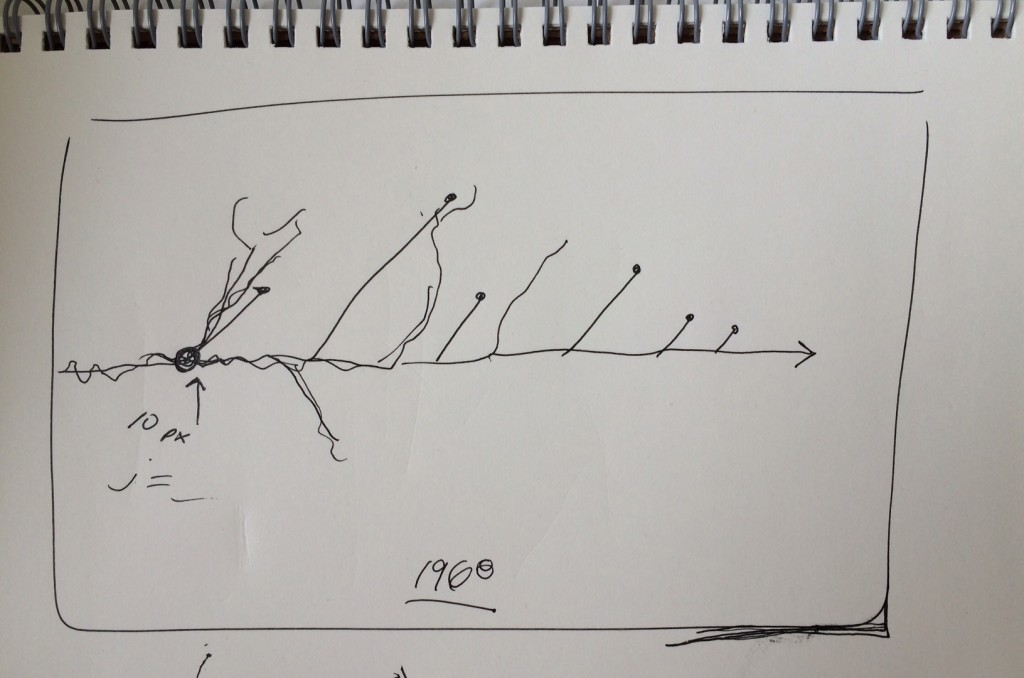
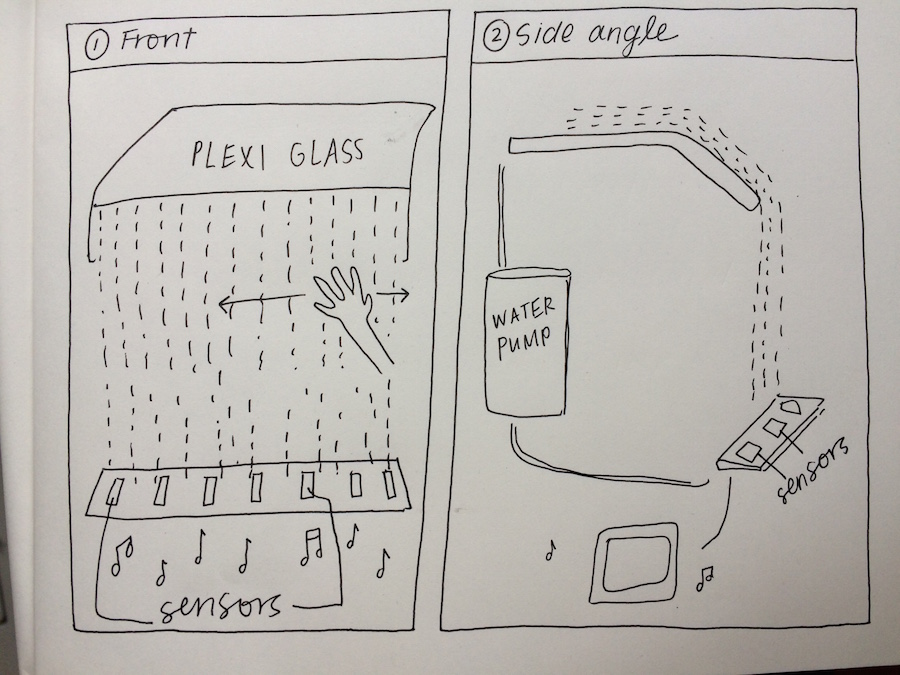
At first, I envisioned an animated visualization that snaked across the screen and split into fractals as you cycled through each year in the database. I liked the idea of having the design mimic the structure of the Colorado River. Here was my initial sketch:
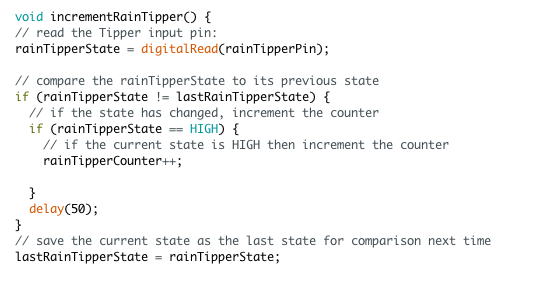
I started playing around with the code and was able to produce an array of values from the CVC file. For instance, I created an array “elevation[]” that pulled the water elevation value for a given year. I wrote some code that allowed me to cycle through the years:

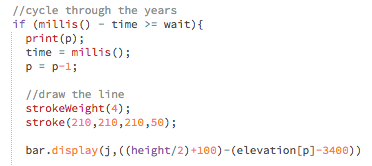
After getting the years to cycle chronologically, I made an animation of a white line moving across the screen. For each new year, I wanted to draw a bar extending from the white line that helped visualize how the water levels were changing from year to year.
I created a function Bar () and gave it some parameters for drawing each of the bars.


After defining the function, I started the animation by typing bar.display () with the specified parameters under function draw (). The bars were now a new object.
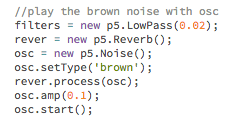
Next, I wanted to add sound to the visualization. I thought about a few different organic sounds: rainfall, rivers flowing, thunder, etc. In the end, I found a field recording of a thunderstorm in southern Utah and I immediately fell in love with the sound.
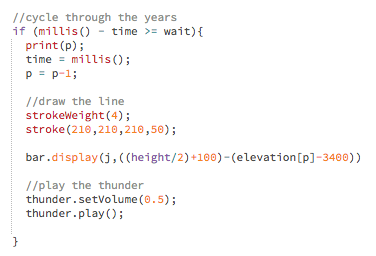
Every time a new year started, I introduced a 20-second clip of the sound so that over time you can hear the rolling thunder. I added some brown noise to sit underneath the sound file and some oscillation effects.
When a new year starts, a new sound file plays, layering over the last sound. When the visualization finishes, the sound disconnects.
 Here’s a video of the visualization:
Overall, I liked how this sketch turned out, but I had some major problems with this visualization.
First off, I think that the data I obtained (water elevation values by year) told a much less dramatic story than I had expected. I realized as I was doing research for this blog post that during droughts, it’s not the reservoir levels that experience the most dramatic decline, but the outflux of water is reduced significantly. I think that if I were to do this project again, I would have spent more time researching the data set I wanted to use.
Second, I really didn’t love the simple animated graph I produced. Yes, it told the story in a straightforward way, but I really wanted to produce a fractal/river shape that was more visually compelling than just straight lines. I couldn’t figure out how to do it in time so I might try doing it for a future project.
I think that adding the sounds made this visualization much more interesting and I want to keep exploring the p5.soundLibrary for future sketches.


